Dashboards and AI for small businesses

Your numbers, up to date every morning, without losing your Mondays.

KAVDAL connects your accounting, sales and bank to one simple dashboard. You see where you stand, and we automate the rest.

  • No commitment
  • Reply within 24 business hours
A shop owner smiles at her laptop behind the counter of her hardware store, in morning light.
  • Public prices From €290, no quote to wait for
  • Guaranteed diagnostic Refunded if it doesn’t help
  • Reply within 24 h Business hours, from an expert in your topic
  • You own everything Dashboards, code and access handed over

We start from the tools you already use and, when needed, build from scratch: we adapt to your needs and your infrastructure.

  • Excel
  • Google Sheets
  • Power BI
  • Looker Studio
  • Metabase
  • n8n
  • Make
  • PostgreSQL
  • Python

More time cross-checking spreadsheets than analysing your numbers?

  • Monthly figures arrive too late to act on.

  • Two departments never have the same numbers.

  • Cash problems show up without warning.

  • The same tasks come back every week, by hand.

Just one of these is enough for a conversation. Book a 20-min call

Each tool has its view. Nobody has the big picture.

Your order management, bank, accounting and CRM each tell part of the story. Our dashboards combine their data to give you the numbers you need to steer.

Your software

We combine

Your dashboards

Your decisions

  • Sales (order management)
  • Accounting
  • Bank
  • CRM
  • Stock
  • Deliveries
  • Company register

KAVDAL

One database, updated every night

  1. A connection to each tool, or a simple export
  2. Matching by customer, item and date
  3. The indicators you are missing, calculated
  • True customer profitability 31 unprofitable customers
  • Cash and working capital 78 d to get €1 back
  • Customers: early signals 11 customers drifting away
  • Margin Review the terms of 31 customers
  • Cash Free up €816k of cash
  • Revenue Call 11 customers before they leave

And no more hours spent matching files by hand.

Figures from the example, on fictional data.

Not all your customers make you money

KAVDAL · Steering

True customer profitability

Last 12 months · Oct 25 – Sep 26 Fictional data

Sources combined
  • Sales (order management)
  • Deliveries
  • CRM
  • Bank

Gross margin

€3.37M

30.6% of revenue: the figure you track today

  • Sales (order management)

What is really left

€1.94M

17.6% of revenue, after €1.43M of cost to serve

  • Sales (order management)
  • Deliveries
  • CRM
  • Bank

Customers who cost more than they bring

31 customers

−€137k lost on €612k of revenue

  • Sales (order management)
  • Deliveries
  • CRM
  • Bank

Cost of late payments

€15k

52 customers pay more than 10 d after the due date

  • Accounting
  • Bank

Serving your customers costs 13 pts of margin

From gross margin to what is left, last 12 months

Review first

Result after cost to serve, last 12 months

  • C-101 Tradespeople · €15k −€16k 120 deliveries, average order €127 Minimum order or delivery fee
  • C-138 Tradespeople · €11k −€16k 144 deliveries, average order €75 Minimum order or delivery fee
  • C-090 Tradespeople · €19k −€15k 123 deliveries, average order €156 Minimum order or delivery fee

The cash sleeping in your business

KAVDAL · Steering

Cash and working capital

Last 12 months · Oct 25 – Sep 26 Fictional data

Sources combined
  • Bank
  • Accounting
  • Stock
  • Sales (order management)

Cash on 27 Sep

€818k

Expected low point: €209k on 15 Nov, below the €250k floor

  • Bank
  • Accounting

Cash tied up in the business

€2.03M

67 d of revenue (customers + stock − suppliers)

  • Accounting
  • Stock
  • Sales (order management)

Days to get €1 back

78 d

+19 d in a year

  • Bank
  • Accounting
  • Stock
  • Sales (order management)

Cash you can free up without selling more

€816k

by fixing 4 causes, detailed below

  • Bank
  • Accounting
  • Stock
  • Sales (order management)

€816k to free up without selling one more item

One-off cash released, by cause

  • Bring 41 late payers back to the due date (18 d late on average) €323k
  • Invoice on delivery (84 customers invoiced once a month) €226k
  • Pay 3 suppliers on the due date, not 30 d early €186k
  • Clear 9 items with no sale for over 180 d €81k

Your cash cycle got 19 d longer in a year

In days, month end, over 24 months

  • Customers pay in 62 d a year ago: 53 d
  • Stock covers 68 d a year ago: 58 d
  • You pay in 51 d a year ago: 51 d
  • Total cycle 78 d a year ago: 59 d

Customers who leave without a word

KAVDAL · Steering

Customers: early signals and potential

Last 12 months · Oct 25 – Sep 26 Fictional data

Sources combined
  • Sales (order management)
  • Deliveries
  • CRM
  • Company register

Revenue from customers drifting away

€392k

11 customers, orders down more than 40%

  • Sales (order management)
  • Deliveries
  • CRM

Revenue kept year on year

107%

6 customers lost (€103k)

  • Sales (order management)

Quotes won

27%

−8 pts in a year

  • CRM

Untapped potential

€9.54M

37 customers where you get less than 20% of their spend

  • Sales (order management)
  • Company register

3.0× more late deliveries among customers drifting away

Quarterly orders down more than 40% year on year

  • C-028 Industry and maintenance −77% 1 late delivery · 2 quotes lost · no order for 31 d
  • C-034 Industry and maintenance −41% 2 late deliveries · 1 quote lost · no order for 34 d
  • C-061 Construction firms −44% 5 late deliveries · 3 quotes lost

At C-011, you get 12% of their spend

Your revenue against their estimated spend (headcount × sector spend)

  • C-011 1,134 employees 12% captured €274k / €2.24M
  • C-018 2,367 employees 12% captured €166k / €1.34M
  • C-024 394 employees 11% captured €106k / €962k
  • C-051 536 employees 11% captured €63k / €595k
  • C-031 221 employees 13% captured €78k / €587k

These are examples: every indicator can be changed, added or removed to fit your business.

Everything you need to steer, without changing your habits

We start from your tools. You stay in control, we handle the connections.

One clear dashboard

Sales, margin, cash and customers on one page, up to date every morning.

Alerts at the right time

You hear about a problem before it costs you.

Two colleagues at a wholesaler look at a laptop together in the warehouse office.

AI on repetitive tasks

Invoices, reminders, meeting notes: prepared automatically, approved by you.

Self-sufficient teams

Everything belongs to you, and your teams know how to use it.

  • Team training
  • Full documentation
  • Support from €290/month

For hands-on small businesses

Trade, manufacturing, logistics, services: we speak your language.

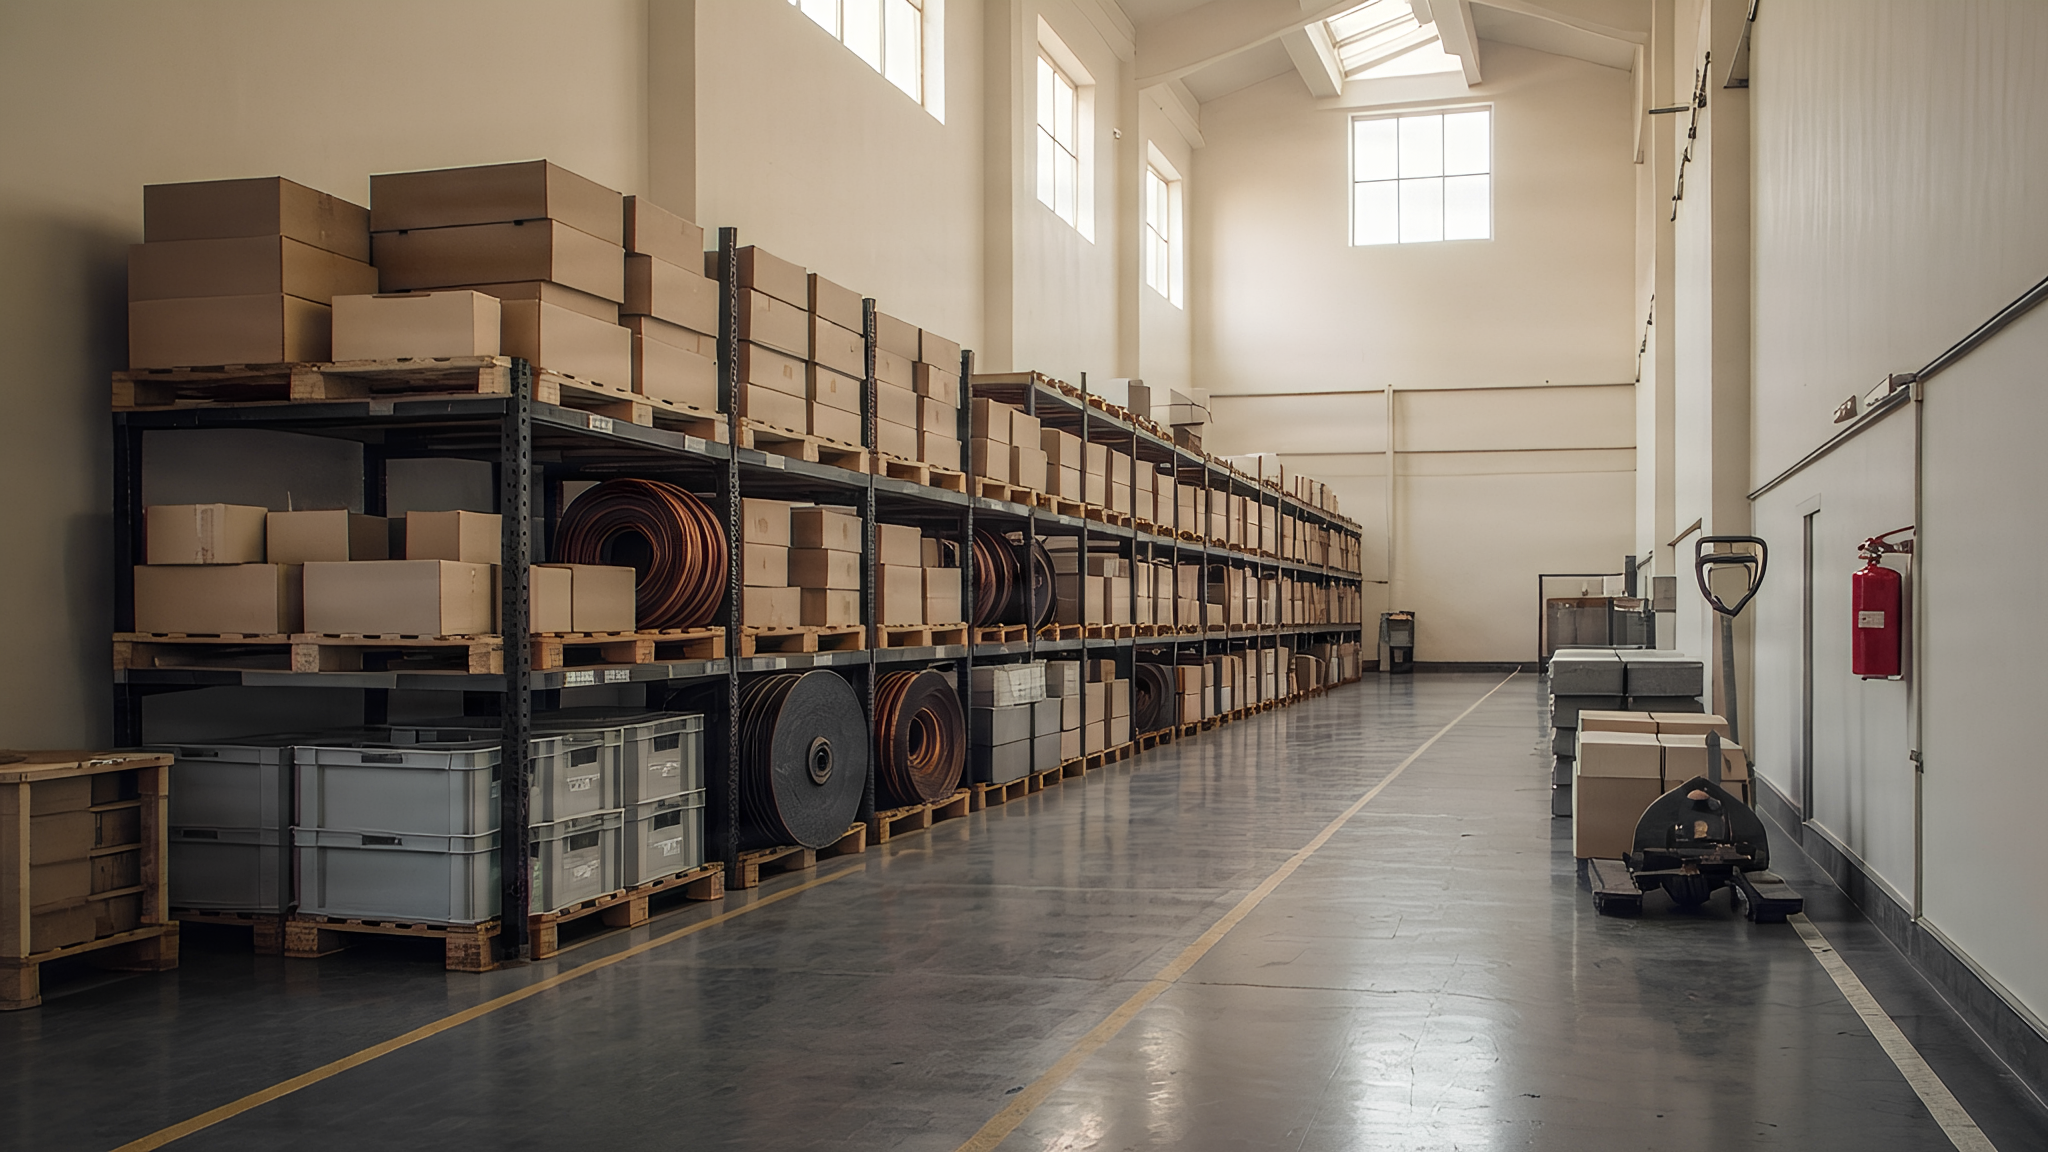
  • Warehouse aisle in natural light: racks of cardboard boxes, coils of copper pipe and grey crates.

    Wholesale and distribution

    Margin by product family, stock-outs, late payments.

  • Workshop in natural light: wooden workbench, tidy tools and stacked boxes.

    Manufacturing and workshops

    Unit costs, order book, lead times.

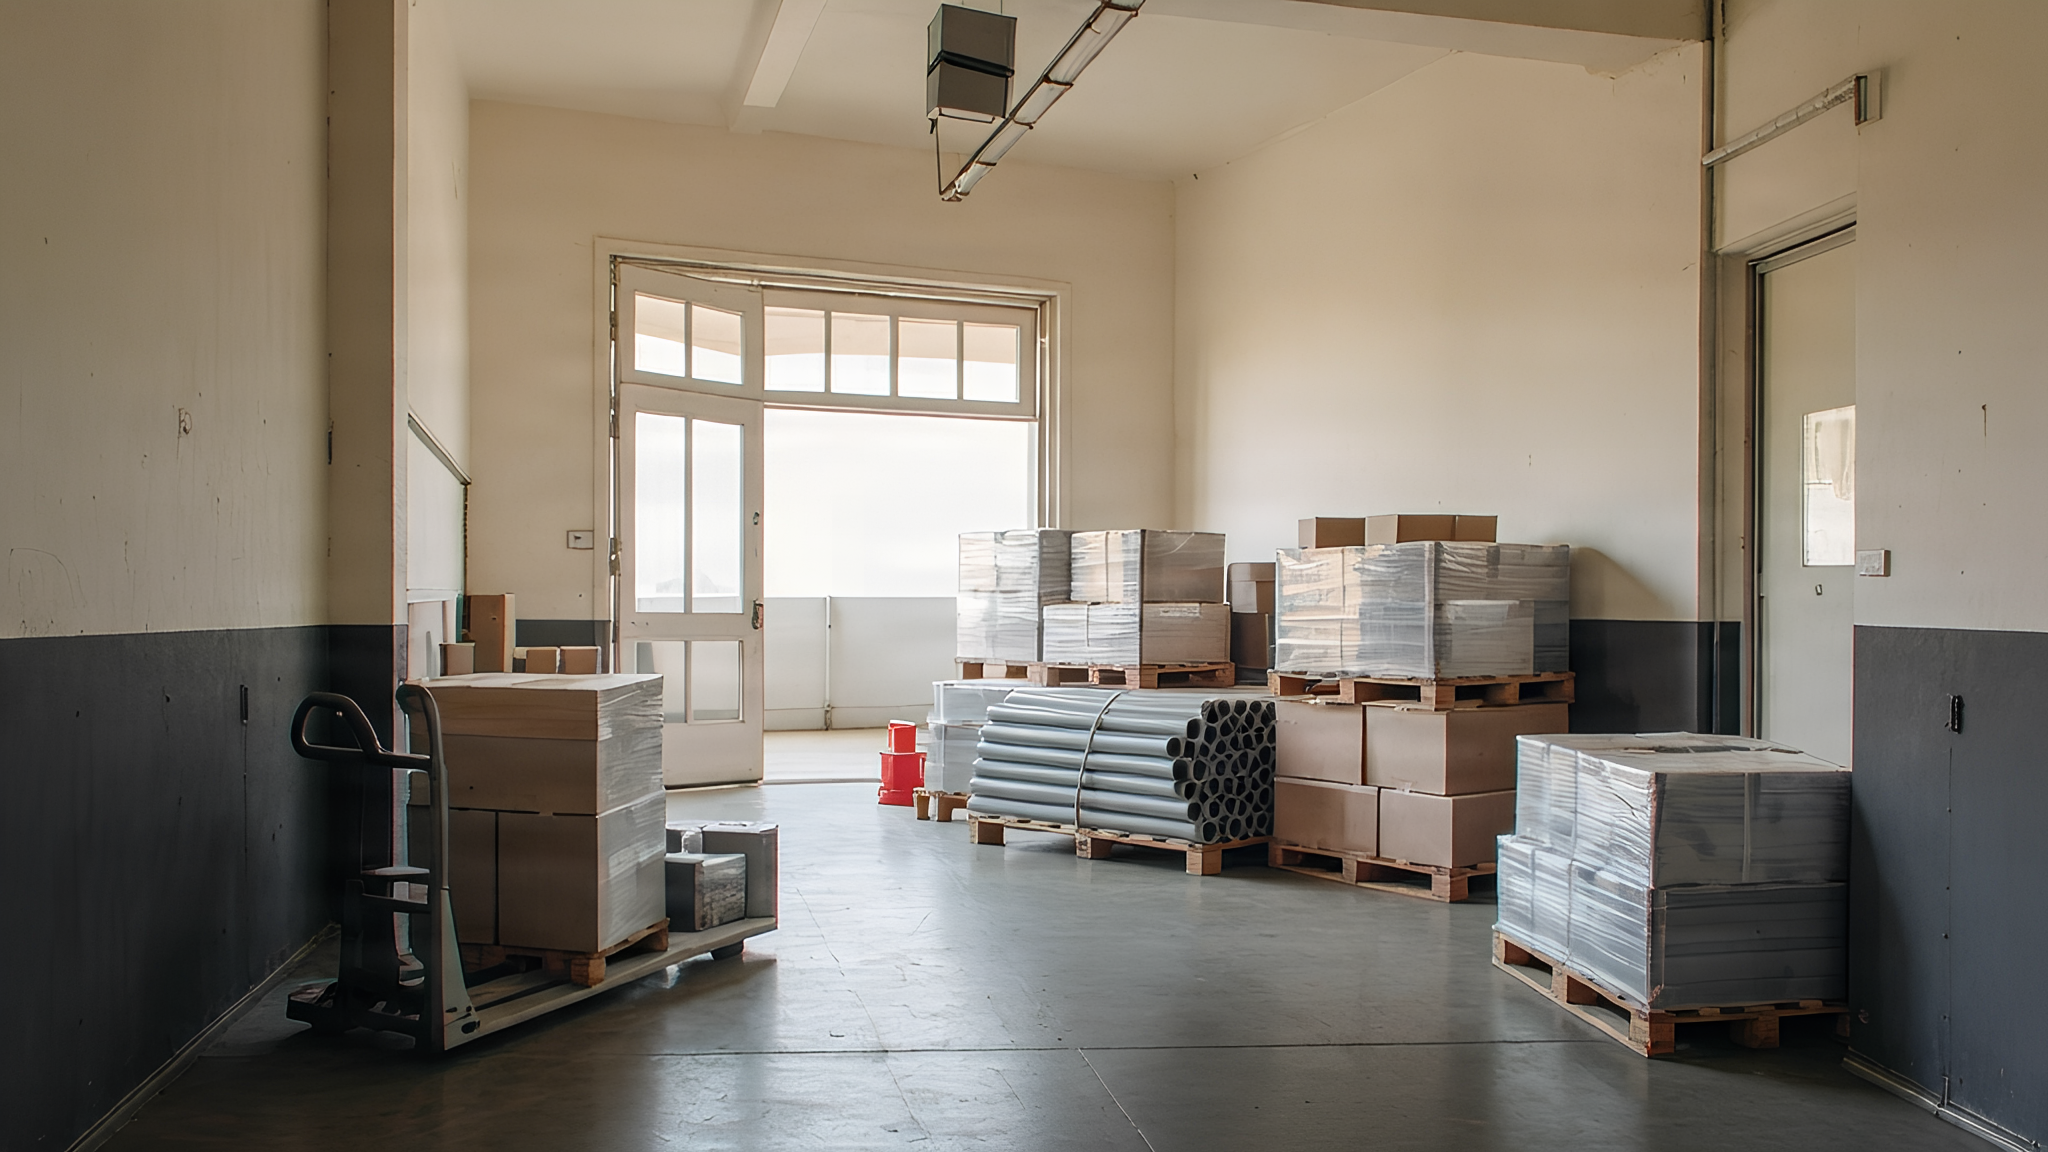
  • Shipping area: prepared orders on stretch-wrapped pallets and bundles of PVC pipes.

    Logistics and transport

    Service level, late lines, cost per delivery.

  • Desk in a small firm: folders, blurred printed sheets and a laptop seen from the side.

    Firms and services

    Time spent, billing, receivables.

How it works

Three steps, prices known in advance.

  1. We take stock

    €290

    5 business days

    We review your tools and files. You leave with 3 to 5 concrete actions.

  2. We build

    from €1,500

    2 to 8 weeks

    Sources connected, dashboards, alerts, training. A first dashboard in 2 weeks.

  3. We stay with you

    from €290/month

    every month

    Maintenance and changes. No minimum term.

Useful or refunded: if you don’t leave the diagnostic with at least 3 concrete actions, we refund it. If a project follows, its €290 is deducted.

Net prices. VAT not applicable, art. 293 B of the French Tax Code.

What does your reporting cost you?

An estimate is already filled in. Adjust the two sliders to your case.

6 hours per week
€45 per hour

6 h × €45 × 52 weeks

What your reporting costs you

€14,040 per year

€42,120 over 3 years

312 hours per year

A first dashboard starts at €1,500, the same as 6 weeks of this reporting.

Calculated in your browser: nothing is sent.

Your questions, answered

How much does it cost?

The data diagnostic costs €290, deducted if a project follows. A first dashboard starts at €1,500, a full setup at €4,500 and monthly support at €290/month. All our prices are on the pricing page. VAT not applicable, art. 293 B of the French Tax Code.

How long does it take?

The diagnostic report arrives in 5 business days. A first dashboard is delivered in 2 weeks, a full setup in 4 to 8 weeks, depending on how many sources need connecting.

Who owns the dashboards and automations?

You do. Files, code, access and documentation are handed over to you. If you stop the support plan, everything keeps working and stays with you.

What do you do with our data? What about GDPR?

Your data stays in your tools and on your accounts. We access it with limited rights, for the duration of the project, and sign a data processing agreement when personal data is involved. We never reuse it for anything else.

Which tools do you work with?

The ones you already have, wherever possible: Excel, Google Sheets, Power BI, Looker Studio, Metabase, n8n or Make. We recommend the simplest tool for your needs, with no licence to resell.

Is my company too small?

No. If someone spends several hours a week compiling numbers by hand, it’s worth a look, even with five people. That’s exactly what the diagnostic checks before you commit to more.

A craftsman smiles on the phone, sitting at his desk in the workshop, an open notebook in front of him.

Let’s talk about your numbers

20 minutes by phone or video, with an expert in your topic. No commitment.

Book a 20-min call

Rather write? contact@kavdal.com